On this page, you can find various measures of competition compiled by the Competition Authority for the information of the public and market participants. These competition indicators can provide an indication of how competitive conditions are developing in Iceland, both over time and in comparison with other countries. The competition indicators are updated regularly, most recently in August 2023.
It should be noted that in some cases, the competitiveness indicators are not published except every few years. For example, the PMR indicator from the OECD is published every 5 years, and the surveys of the Competition Authority are conducted every 3 years.
To assess competition in Icelandic markets, surveys and metrics are used. The International Economic Council (e.g. World Economic Forum) which are published in annual reports on the competitiveness of countries (e.g. Global Competitiveness Report), a measure from The Organisation for Economic Co-operation and Development (OECD) which are published in the institution's database, and Investigations of the Competition Authority on the views of executives and consumers regarding competitive problems and competition law infringements, published in the Competition Authority's series.
Particular attention is paid to indicators that provide an insight into the experience of Icelandic consumers and business executives regarding competitive activity in various markets, concentration in selected markets and to barriers that can be removed to increase competition and thereby promote greater productivity and innovation. The indicators relate to (i) how active competition is, (ii) the degree of market concentration and the extent of market dominance, and (iii) the extent of barriers to market entry.
The position of Iceland is compared over time and with a group of nine comparison countries. The comparison group consists of the United Kingdom, Denmark, Finland, the Netherlands, Ireland, Malta, Norway, New Zealand and Sweden.
Effectiveness of competition
Most countries consider it desirable for active competition to exist in as many areas of economic life as possible. The reason, in a nutshell, is that the vast majority of economic theory strongly supports the view that competition in business is highly desirable, as it increases consumer welfare and promotes efficiency in the economy. Active competition is, for example, considered to contribute to an increased range of products, better services, lower prices, innovation and progress in business, less inequality and lower unemployment.
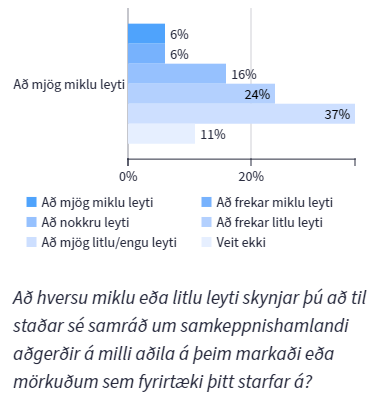
3 out of 10 managers perceive consultation (2020)
This measure is based on the results of a survey (see Report 3/2020) which the Competition Authority conducted in early 2020 among company executives with the aim of shedding light on their knowledge and attitudes towards competition issues. It is planned that this survey will be conducted every three years, and it is therefore expected that the results of the next survey will be published in 2023.
According to the survey results, 28% of company executives perceive some, quite a lot or a very large degree of consultation in the markets in which their companies operate. 61% perceive consultation to a rather small, very small or no extent, and 11% said they were unsure.
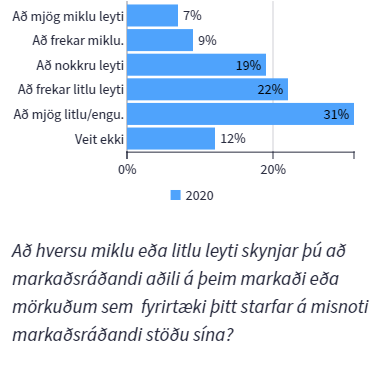
1 in 3 executives perceive that dominant companies abuse their position (2020)
This measure is based on the results of a survey (see Report 3/2020) which the Competition Authority conducted in early 2020 among company executives with the aim of shedding light on their knowledge and attitudes towards competition issues. It is planned that this survey will be conducted every three years, and it is therefore expected that the results of the next survey will be published in 2023.
According to the survey results, 35% of managers perceive the abuse of a dominant market position to some, quite a large or a very large extent in the markets in which the company operates. 53% perceive the abuse of a dominant market position to a rather small, very small or no extent, and 12% said they were unsure.
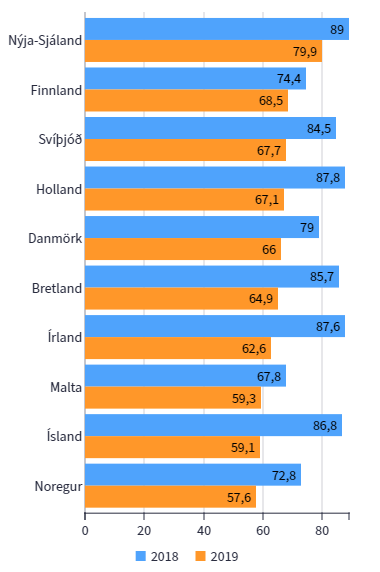
Iceland in 5th place out of 10 (2019)
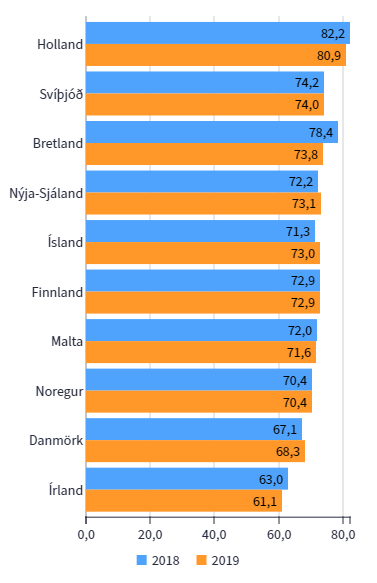
This indicator is based on surveys by the World Economic Forum, which are conducted annually (most recently in 2019). There, respondents are asked, among other things, how intense the competition is in the markets for professional services, retail services and infrastructure services. Respondents provide an answer on a scale of 1–7 for each market, where 1 means that competition is almost non-existent and 7 means that competition is very intense.* The average is calculated from the responses about the three markets, and these responses are converted to the 0–100 scale, where 100 indicates a best-case scenario.
Iceland was ranked seventh out of the ten countries compared in 2018, and fifth in 2019. Competition in service markets was highest in the Netherlands in both years. Ireland was ranked lowest in both years, with Denmark second lowest.
In English, the question was: “In your country, how competitive is the provision of the following services: professional services (legal services, accounting, engineering, etc.); retail services; and the network sector (telecommunications, utilities, postal, transport, etc.)?“
Most in passenger and financial services (2019)
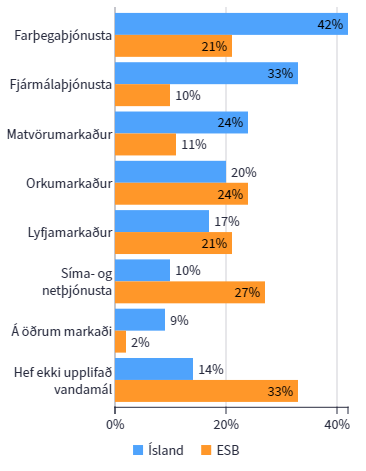
This indicator is based on the results of a survey by the Competition Authority (see report 1/2019) on public attitudes towards competition matters. The survey was conducted in the first half of 2019 in connection with survey which the European Commission has had conducted three times in all the Union's member states.
Most had experienced competitive problems in the passenger transport services market (42%), financial services (33%) and food products (24%). Among European consumers, most mentioned that they had experienced problems in the telecommunications and internet services market (26%), the energy market (23%) and the pharmaceutical market (20%).
When the responses of Icelandic consumers are compared with those of consumers in the EU Member States, it is revealed that a significantly higher proportion of consumers experience competitive problems in markets relating to passenger services, financial services and the food market, whereas a significantly lower proportion experience competitive problems in the markets for telephone and internet services. Furthermore, the proportion of those who say they have not experienced any problems is considerably lower among Icelandic consumers compared to consumers in the EU member states.
Respondents to the survey could select the two markets where they had experienced the most competitive problems, and therefore the total of the response options is higher than 100%. (Asked: „Have you ever experienced problems due to a lack of competition in any of the following markets that led to higher prices than would otherwise be the case, a limited choice of products or suppliers, or lower quality?“)
Consolidation and market dominance
The term „concentration“ originates in industrial economics and refers to how activity in a particular market is distributed among the firms operating within it. High concentration generally indicates relatively limited competition, whereas low concentration indicates intense competition. It should be noted that various other considerations are also taken into account, such as the evolution of market shares over time, the financial strength of market participants, and barriers to market entry. In concentrated markets, there is generally a greater risk than otherwise that companies with a strong position may be in a position to hinder effective competition and operate largely without taking competitors, customers and consumers into account. For this reason, both published measures of concentration and the assessment by the management of Icelandic companies of the extent of market dominance are presented here.
High concentration, but has been decreasing in 3 out of 4 markets.
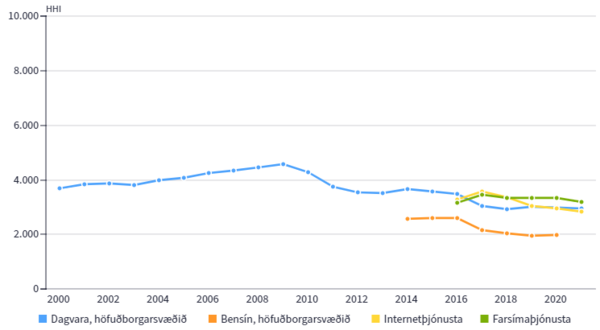
One measure of market concentration is the so-called Herfindahl-Hirschman index , or the HHI index in Icelandic. It is considered one of the most reliable indicators of how much market concentration there is.
The HHI index is the sum of the squares of the market shares of the companies in a market. The value of the index lies between 0 and 10,000, but the higher the value, the greater the market concentration. The value of the index is 10,000 if there is only one company in the market (1002 = 10,000), and approaches 0 if all companies in the market have a very small market share each. The HHI for a market with three firms, with market shares of 70%, 20% and 10%, is 702+202+102 = 5,400).
Markets where the HHI value is below 1,000 are generally considered to be actively competitive markets. Concentration is considered moderate when the HHI value is between 1,000 and 1,800, but high concentration is present when the value exceeds 1,800 points.
In the four markets analysed, concentration is high but has been decreasing in three. It should, however, be noted that there is significant cross-market ownership in the four aforementioned markets, and the findings on concentration trends should be interpreted with this caveat, as discussed above.
In the capital region's grocery market, concentration was highest in 2009 and has largely been decreasing since, from around 4,500 points in 2009 to around 2,900 in 2020. Concentration in the internet service market and petrol sales at filling stations in the capital region decreased between 2016 and 2020/2021, but concentration in mobile phone services has largely remained stable over the same period.
Iceland in last place, 10 out of 10 (2019)
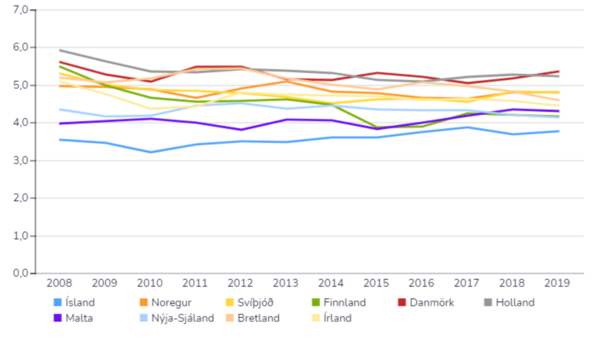
Companies with a strong market position can be in a position to hinder effective competition and operate largely without taking competitors, customers and consumers into account. The World Economic Forum measures the extent of market dominance in a survey sent to business executives around the world. Respondents are asked about the extent of market dominance in the country in which they operate.
The measure is based on responses to the question, „How would you best describe the market in your country?“, with responses given on a scale of 1–7, where 1 means that a few companies dominate the market and 7 means that market dominance is shared among many companies. Higher values are preferable to lower ones. In English, the question was: „In your country, how do you characterise corporate activity?“ [1 = dominated by a few business groups; 7 = spread among many firms]
The concentration of market dominance is the highest in Iceland of all the countries compared, i.e. market dominance is shared among a few companies here. In 2019, the highest competition was measured in this way in Denmark, followed by the Netherlands. These two countries have occupied the top positions in recent years.
Barriers to access
It usually involves some cost and effort for a company to start operating in a new market, but this is referred to as barriers to entry. If there are no barriers to entry in a market, new companies are expected to enter and start operating as soon as profit opportunities arise. This makes such a market generally more efficient than markets where barriers to entry exist.
Iceland in 9th place out of 10 (2019)
This indicator is intended to measure trade openness, and is based on four indicators concerning (i) the extent of non-tariff trade barriers, (ii) tariffs, (iii) tariff complexity, and (iv) customs clearance efficiency.
In 2019, Iceland was ranked ninth out of the ten countries. Only in Norway was the business environment more closed. In New Zealand, the business environment was the most open, and there was a considerable gap between it and the countries that followed. The business environment became more closed in all the countries between 2018 and 2019, but Iceland's position within the group worsened, dropping from fourth place to ninth.
The indicators are all based on questionnaires and are on a 1–7 scale. They are then combined into a single, larger indicator which measures how open the business environment is, which is the one shown in the figure above. The index takes values on a scale of 0–100, where 100 signifies the most favourable conditions. Further information on the sub-indices can be found in the report. The International Economic Council.
Iceland in 9th place out of 10 (2018)
In 2018, Iceland was ranked ninth out of the ten countries in terms of overall economic regulatory burden. Only in Malta was the regulatory burden more extensive. The regulatory burden was lowest in the United Kingdom, and there was a considerable difference between it and the countries that followed. Iceland was rated as having the greatest regulatory burden in the retail sector, but the fourth lowest in relation to the internet sector. In all cases, the regulatory burden was lowest in the United Kingdom.
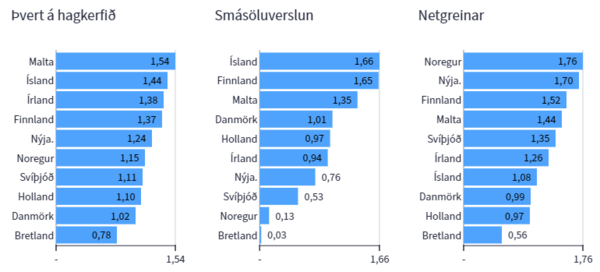
General information about the scale
The OECD maintains so-called PMR metrics (i.e. product market regulation) which is intended to measure, in a comparable manner, the extent of laws and regulations that hinder the entry of new players into the market and, thereby, competition. Numerous factors are taken into consideration, such as licensing, public procurement, corporate governance, price regulation, regulation, and so on.
Regulatory burden in the retail sector
When calculating the OECD indicator for retail regulatory burden, the following aspects are considered: (i) business registration, (ii) regulations concerning shop opening hours, (iii) regulations concerning retail pricing, and (iv) regulations concerning online sales.
Regulatory burden in the online sector
In calculating this OECD indicator, legislation and regulatory burden are examined in the markets for energy, transport (by land, sea and air), and telecommunications.
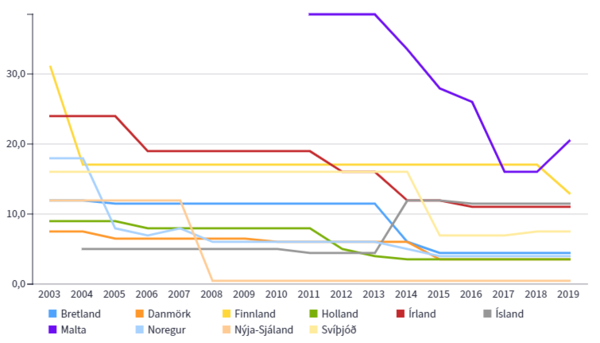
Iceland in 8th place out of 10 (2019)
The World Bank maintains and publishes metrics on the average time it takes to set up a business. Here The number of working days required to legally establish a company.
In 2019, Iceland was ranked sixth out of all the countries compared. It then took 11.5 days to set up a business in the country, a figure that had remained unchanged since 2014. Between 2003 and 2013, however, it took 4-4.5 days to set up a business. Since the last measurements were published by the World Bank, changes have been made to Registration process for limited companies and now takes 4–5 working days to set up, instead of the previous 10–12.