

On this page, you can find various measures of competition compiled by the Competition Authority for the information of the public and market participants. These competition indicators can provide an indication of how competitive conditions are developing in Iceland, both over time and in comparison with other countries. The competition indicators are updated regularly, most recently in August 2023.
It should be noted that in some cases, the competitiveness indicators are not published except every few years. For example, the PMR indicator from the OECD is published every 5 years, and the surveys of the Competition Authority are conducted every 3 years.
Samkeppnisvísarnir eru hýstir á GRID en hér má skoða síðu Samkeppniseftirlitsins á miðlinum.
To assess competition in Icelandic markets, surveys and metrics are used. The International Economic Council (e.g. World Economic Forum) which are published in annual reports on the competitiveness of countries (e.g. Global Competitiveness Report), a measure from The Organisation for Economic Co-operation and Development (OECD) which are published in the institution's database, and Investigations of the Competition Authority on the views of executives and consumers regarding competitive problems and competition law infringements, published in the Competition Authority's series.
Particular attention is paid to indicators that provide an insight into the experience of Icelandic consumers and business executives regarding competitive activity in various markets, concentration in selected markets and to barriers that can be removed to increase competition and thereby promote greater productivity and innovation. The indicators relate to (i) how active competition is, (ii) the degree of market concentration and the extent of market dominance, and (iii) the extent of barriers to market entry.
The position of Iceland is compared over time and with a group of nine comparison countries. The comparison group consists of the United Kingdom, Denmark, Finland, the Netherlands, Ireland, Malta, Norway, New Zealand and Sweden.
Most countries consider it desirable for active competition to exist in as many areas of economic life as possible. The reason, in a nutshell, is that the vast majority of economic theory strongly supports the view that competition in business is highly desirable, as it increases consumer welfare and promotes efficiency in the economy. Active competition is, for example, considered to contribute to an increased range of products, better services, lower prices, innovation and progress in business, less inequality and lower unemployment.
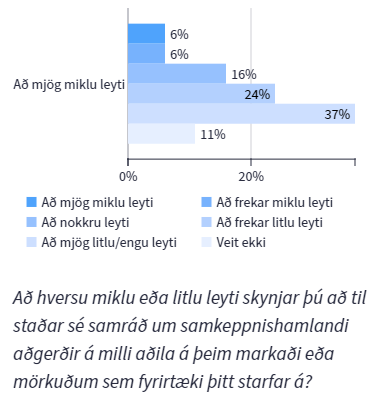
This measure is based on the results of a survey (see Report 3/2020) sem Samkeppniseftirlitið framkvæmdi í byrjun árs 2020 á meðal stjórnenda fyrirtækja með það að markmiði að varpa ljósi á þekkingu og viðhorf þeirra til samkeppnismála. Áætlað er að sú könnun sé framkvæmd á þriggja ára fresti og því má gera ráð fyrir að niðurstöður næstu könnunar verði birtar árið 2023.
According to the survey results, 28% of company executives perceive some, quite a lot or a very large degree of consultation in the markets in which their companies operate. 61% perceive consultation to a rather small, very small or no extent, and 11% said they were unsure.
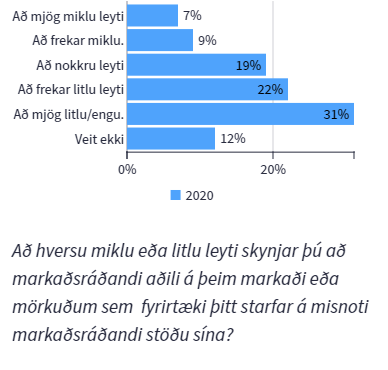
This measure is based on the results of a survey (see Report 3/2020) sem Samkeppniseftirlitið framkvæmdi í byrjun árs 2020 á meðal stjórnenda fyrirtækja með það að markmiði að varpa ljósi á þekkingu og viðhorf þeirra til samkeppnismála. Áætlað er að sú könnun sé framkvæmd á þriggja ára fresti og því má gera ráð fyrir að niðurstöður næstu könnunar verði birtar árið 2023.
According to the survey results, 35% of managers perceive the abuse of a dominant market position to some, quite a large or a very large extent in the markets in which the company operates. 53% perceive the abuse of a dominant market position to a rather small, very small or no extent, and 12% said they were unsure.
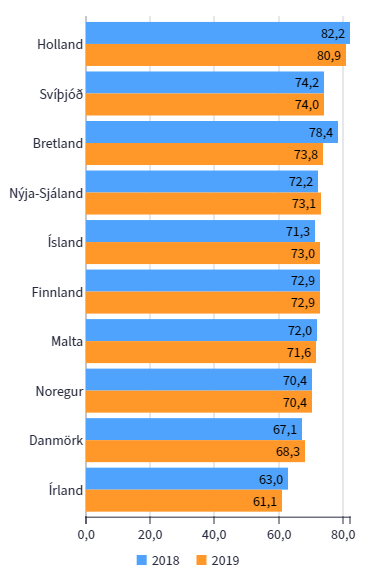
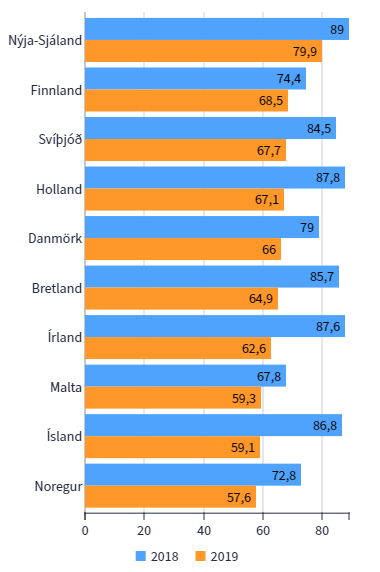
This indicator is based on surveys by the World Economic Forum, which are conducted annually (most recently in 2019). There, respondents are asked, among other things, how intense the competition is in the markets for professional services, retail services and infrastructure services. Respondents provide an answer on a scale of 1–7 for each market, where 1 means that competition is almost non-existent and 7 means that competition is very intense.* The average is calculated from the responses about the three markets, and these responses are converted to the 0–100 scale, where 100 indicates a best-case scenario.
Iceland was ranked seventh out of the ten countries compared in 2018, and fifth in 2019. Competition in service markets was highest in the Netherlands in both years. Ireland was ranked lowest in both years, with Denmark second lowest.
* Á ensku var spurningin “In your country, how competitive is the provision of the following services: professional services (legal services, accounting, engineering,etc.); retail services; and network sector (telecommunications, utilities, postal, transport, etc.)?“
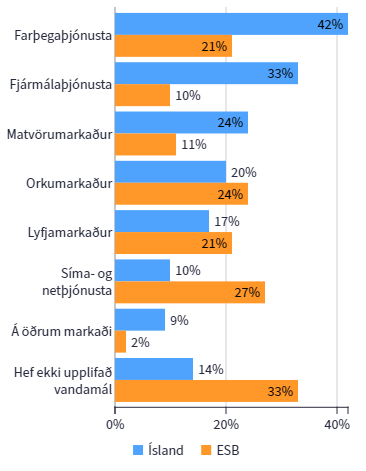
This indicator is based on the results of a survey by the Competition Authority (see report 1/2019) on public attitudes towards competition matters. The survey was conducted in the first half of 2019 in connection with survey which the European Commission has had conducted three times in all the Union's member states.
Most had experienced competitive problems in the passenger transport services market (42%), financial services (33%) and food products (24%). Among European consumers, most mentioned that they had experienced problems in the telecommunications and internet services market (26%), the energy market (23%) and the pharmaceutical market (20%).
Þegar svör íslenskra neytenda eru borin saman við svör neytenda í ESB ríkjunum kemur í ljós að talsvert hærra hlutfall neytenda upplifir samkeppnisleg vandamál á mörkuðum sem varða farþegaþjónustu, fjármálaþjónustu og matvörumarkað en umtalsvert lægra hlutfall upplifir samkeppnisleg vandamál á mörkuðum fyrir síma- og netþjónustu. Þá er hlutfall þeirra sem segjast ekki hafa upplifað nein vandamál töluvert lægra á meðal íslenskra neytenda samanborið við neytendur í ESB ríkjunum.
* Svarendur könnunarinnar gátu valið þá tvo markaði þar sem þeir höfðu upplifað mest samkeppnisleg vandamál, og því er summa svarmöguleika hærri en 100%. (Spurt var: „Hefur þú einhvern tímann upplifað vandamál sökum skorts á samkeppni á einhverjum af eftirfarandi mörkuðum sem leiddu til hærra verðs en ella takmarkaðs úrvals af vörum eða söluaðilum eða minni gæða?“)
Hugtakið „samþjöppun“ (e. concentration) á uppruna sinn í atvinnuvegahagfræði og vísar til þess hvernig starfsemi á tilteknum markaði deilist niður á fyrirtækin sem þar starfa. Mikil samþjöppun bendir almennt til fremur takmarkaðrar samkeppni en lítil samþjöppun til mikillar samkeppni. Rétt er að taka fram að ýmis önnur sjónarmið eru einnig höfð til viðmiðunar, s.s. þróun hlutdeildar yfir tíma, fjárhagslegur styrkleiki markaðsaðila og aðgangshindranir að markaði.
Á samþjöppuðum mörkuðum er almennt meiri hætta en ella á að fyrirtæki með sterka stöðu geti verið í aðstöðu til þess að hindra virka samkeppni og starfa að verulegu leyti án þess að taka tillit til keppinauta, viðskiptavina og neytenda. Vegna þessa eru hér bæði birtir mælikvarðar fyrir samþjöppun og mat stjórnenda íslenskra fyrirtækja um umfang markaðsyfirráða.
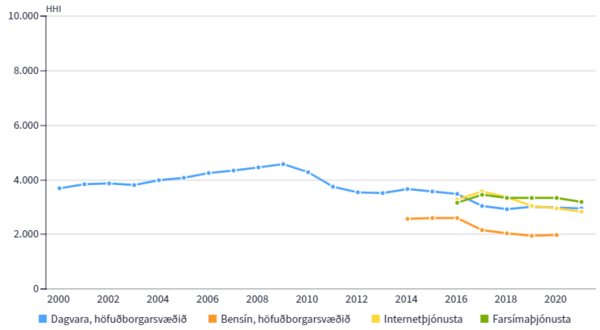
One measure of market concentration is the so-called Herfindahl-Hirschman index , or the HHI index in Icelandic. It is considered one of the most reliable indicators of how much market concentration there is.
HHI stuðullinn er summa ferningstalna markaðshlutdeilda fyrirtækja á markaði. Gildi stuðulsins liggur á milli 0 og 10.000, en því hærra sem gildið er þeim mun meiri er samþjöppun á markaði. Gildi stuðulsins er 10.000 ef aðeins eitt fyrirtæki er á markaðnum (1002 = 10.000), en sem næst 0 séu öll fyrirtæki á markaðnum með örlitla markaðshlutdeild hvert fyrir sig. HHI stuðull á markaði þar sem eru þrjú fyrirtæki, með markaðshlutdeildir 70%, 20% og 10%, er 702+202+102 = 5.400).
Markets where the HHI value is below 1,000 are generally considered to be actively competitive markets. Concentration is considered moderate when the HHI value is between 1,000 and 1,800, but high concentration is present when the value exceeds 1,800 points.
In the four markets analysed, concentration is high but has been decreasing in three. It should, however, be noted that there is significant cross-market ownership in the four aforementioned markets, and the findings on concentration trends should be interpreted with this caveat, as discussed above.
In the capital region's grocery market, concentration was highest in 2009 and has largely been decreasing since, from around 4,500 points in 2009 to around 2,900 in 2020. Concentration in the internet service market and petrol sales at filling stations in the capital region decreased between 2016 and 2020/2021, but concentration in mobile phone services has largely remained stable over the same period.
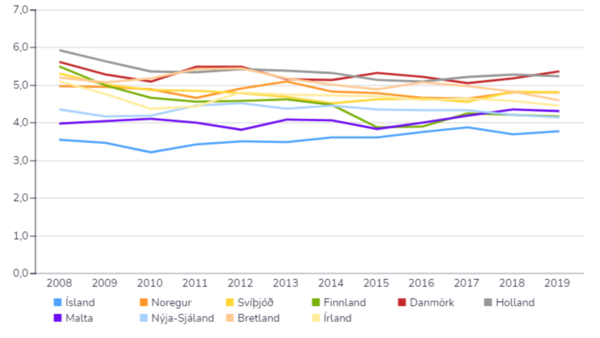
Companies with a strong market position can be in a position to hinder effective competition and operate largely without taking competitors, customers and consumers into account. The World Economic Forum measures the extent of market dominance in a survey sent to business executives around the world. Respondents are asked about the extent of market dominance in the country in which they operate.
Mælikvarðinn byggir á svörum við spurningunni „Hvernig er starfsemi á markaði best lýst í þínu landi?“ þar sem svör eru gefin á bilinu 1–7, þar sem 1 merkir að nokkur fyrirtæki fari með markaðsyfirráð og 7 merkir að markaðsyfirráð deilast á mörg fyrirtæki. Æskilegra er að gildi séu hærri en lægri. Á ensku var spurningin „In your country, how do you characterize corporate activity?“ [1 = dominated by a few business groups; 7 = spread among many firms]
The concentration of market dominance is the highest in Iceland of all the countries compared, i.e. market dominance is shared among a few companies here. In 2019, the highest competition was measured in this way in Denmark, followed by the Netherlands. These two countries have occupied the top positions in recent years.
Það fylgir því venjulega einhver kostnaður og fyrirhöfn fyrir fyrirtæki að hefja starfsemi á nýjum markaði, en slíkt er talað um sem aðgangshindranir. Ef engar aðgangshindranir eru til staðar á markaði er viðbúið að ný fyrirtæki komi og hefji starfsemi á honum um leið og hagnaðartækifæri gefast. Þetta gerir það að verkum að slíkur markaður er alla jafna skilvirkari en markaðir þar sem aðgangshindranir eru til staðar.
Þessum mælikvarða er ætlað að mæla hversu opið viðskiptaumhverfið er (e. trade openness), og byggir á fjórum mælikvörðum sem lúta að (i) umfangi viðskiptahindrana annarra en tolla, (ii) tollum, (iii) flækjustigi tolla, og (iv) skilvirkni tollafgreiðslu.
Árið 2019 var Ísland í níunda sæti af löndunum tíu. Einungis í Noregi var viðskiptaumhverfið lokaðra. Í Nýja-Sjálandi var viðskiptaumhverfið opnast og munaði nokkru milli þess og þeirra landa sem á eftir komu. Viðskiptaumhverfið varð lokaðra í öllum ríkjunum á milli 2018 og 2019, en staða Íslands innan hópsins versnaði, lækkaði úr fjórða sæti niður í það níunda.
Mælikvarðarnir byggja allir á spurningakönnunum og eru á skalanum 1–7. Þeir eru síðan teknir saman í einn stærri mælikvarða sem mælir hversu opið viðskiptaumhverfið er, sem er sá sem birtur er á mynd hér að ofan. Mælikvarðinn tekur gildi á bilinu 0–100, þar sem 100 merkir aðstæður sem best er á kosið. Frekari upplýsingar um undirmælikvarða má finna í skýrslu The International Economic Council.
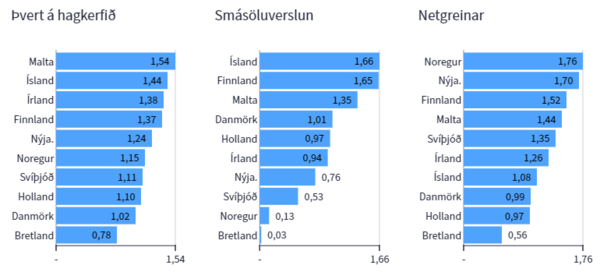
In 2018, Iceland was ranked ninth out of the ten countries in terms of overall economic regulatory burden. Only in Malta was the regulatory burden more extensive. The regulatory burden was lowest in the United Kingdom, and there was a considerable difference between it and the countries that followed. Iceland was rated as having the greatest regulatory burden in the retail sector, but the fourth lowest in relation to the internet sector. In all cases, the regulatory burden was lowest in the United Kingdom.
General information about the scale
The OECD maintains so-called PMR metrics (e. product market regulation) sem ætlað er að mæla á samanburðarhæfan hátt umfang laga og regluverks sem hindrar innkomu nýrra aðila á markaði og þar með samkeppni. Fjölmörg atriði koma hér til skoðunar, s.s. leyfisveitingar, opinber útboð, stjórnarhættir, verðkvaðir (e. price regulation), regluverk og svo framvegis.
Regulatory burden in the retail sector
When calculating the OECD indicator for retail regulatory burden, the following aspects are considered: (i) business registration, (ii) regulations concerning shop opening hours, (iii) regulations concerning retail pricing, and (iv) regulations concerning online sales.
Regulatory burden in the online sector
In calculating this OECD indicator, legislation and regulatory burden are examined in the markets for energy, transport (by land, sea and air), and telecommunications.
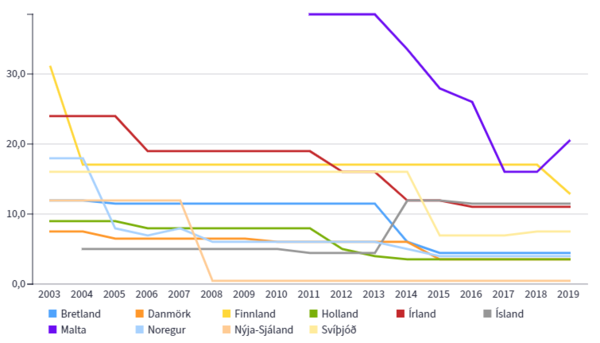
The World Bank maintains and publishes metrics on the average time it takes to set up a business. Here The number of working days required to legally establish a company.
In 2019, Iceland was ranked sixth out of all the countries compared. It then took 11.5 days to set up a business in the country, a figure that had remained unchanged since 2014. Between 2003 and 2013, however, it took 4-4.5 days to set up a business. Since the last measurements were published by the World Bank, changes have been made to Registration process for limited companies and now takes 4–5 working days to set up, instead of the previous 10–12.
"*" indicates required fields